Thanks for dropping in!
What did I learn from this project?
This project taught me a lot about deep learning basics. We went through the mathematics of deep learning, but it is hard to follow and feels hard to know the ‘useful’ information until you make a model yourself. This was my first time dabbling in all of the data and figuring out exactly the use of learning rates and why a reasonable learning rate varies from problem to problem so much. I also worked on a simple loss function using gradient descent to optimize the parameters for the tree.
Basis
This was not only my first experience with linear regression but also with deep learning as a whole. This was assigned by a professor as homework, but I still thought it was interesting and useful enough to post about what I learned.
Photographic Results
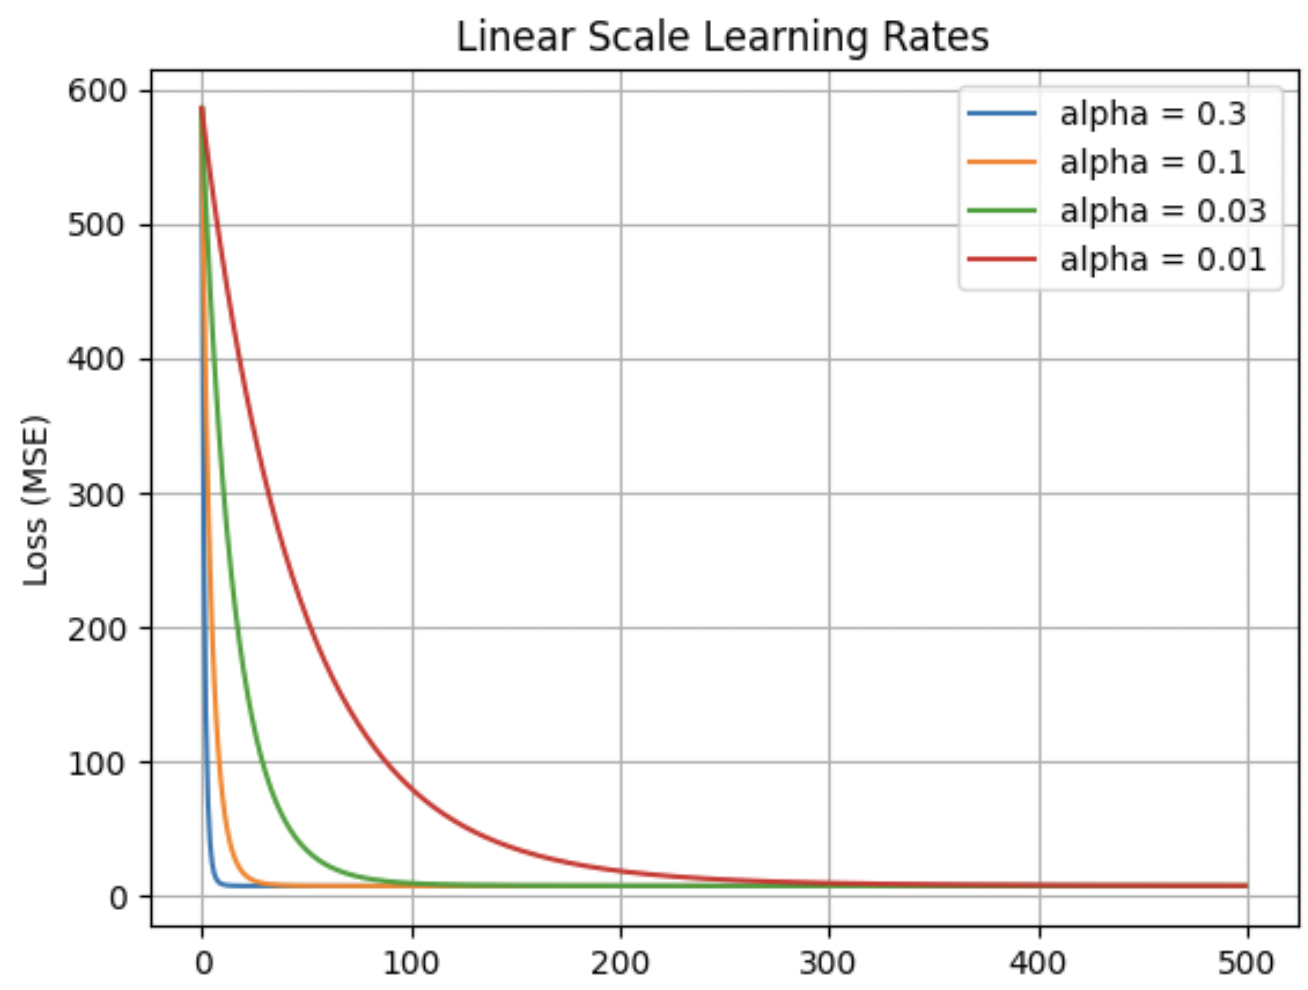
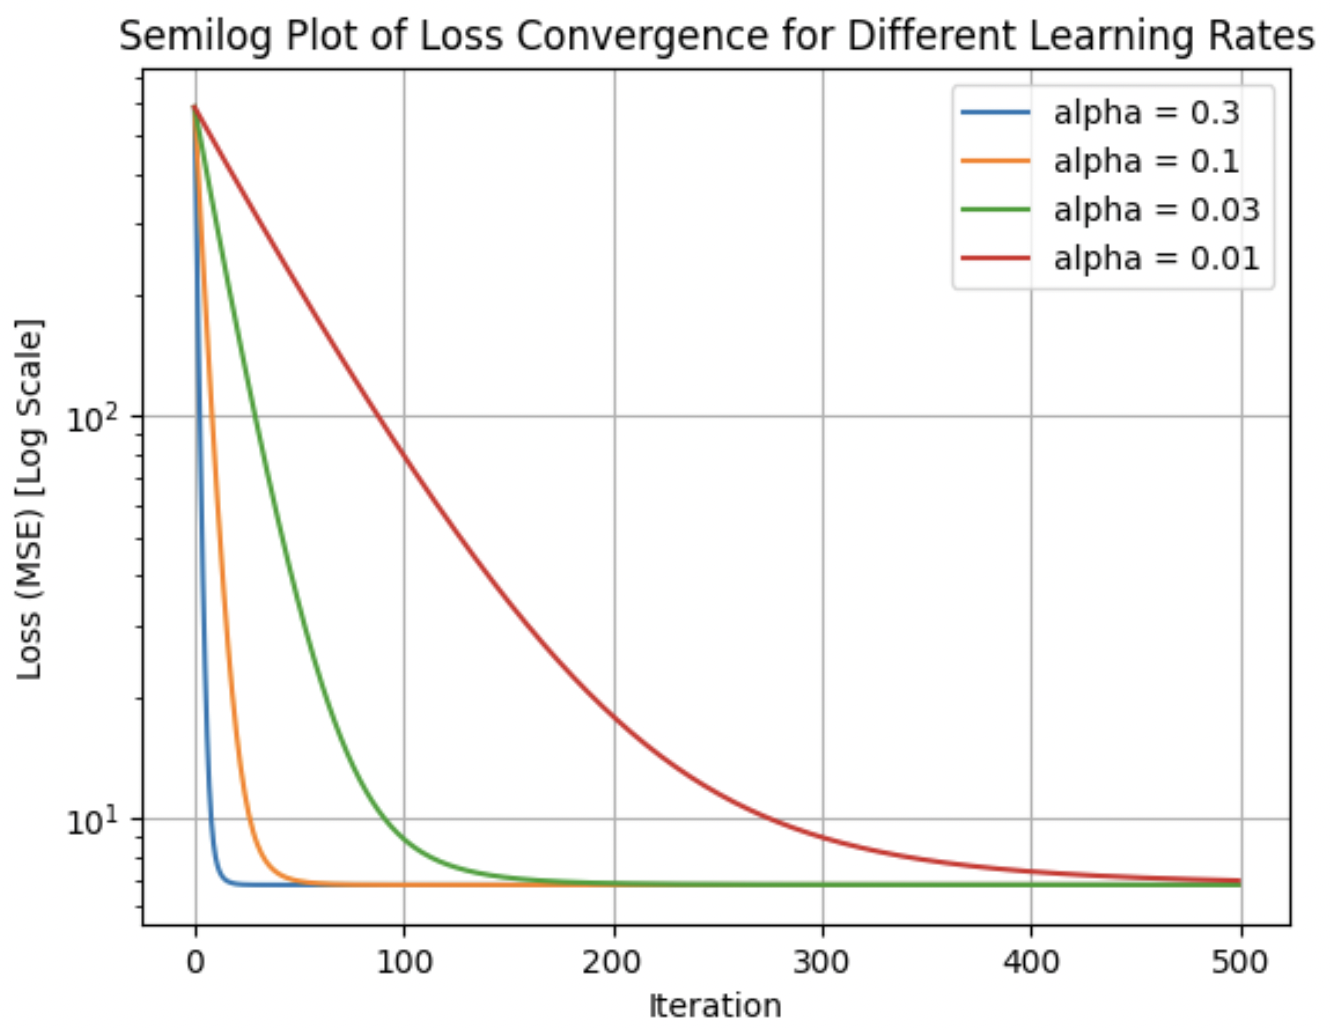
There are also several different learning rates used for this project, and you can see how each reduces the loss. You can see that the loss for all learning rates rapidly decreases using gradient descent. This problem was both very simple and did not have a vast data set, so the simplistic results and low computation time are expected.
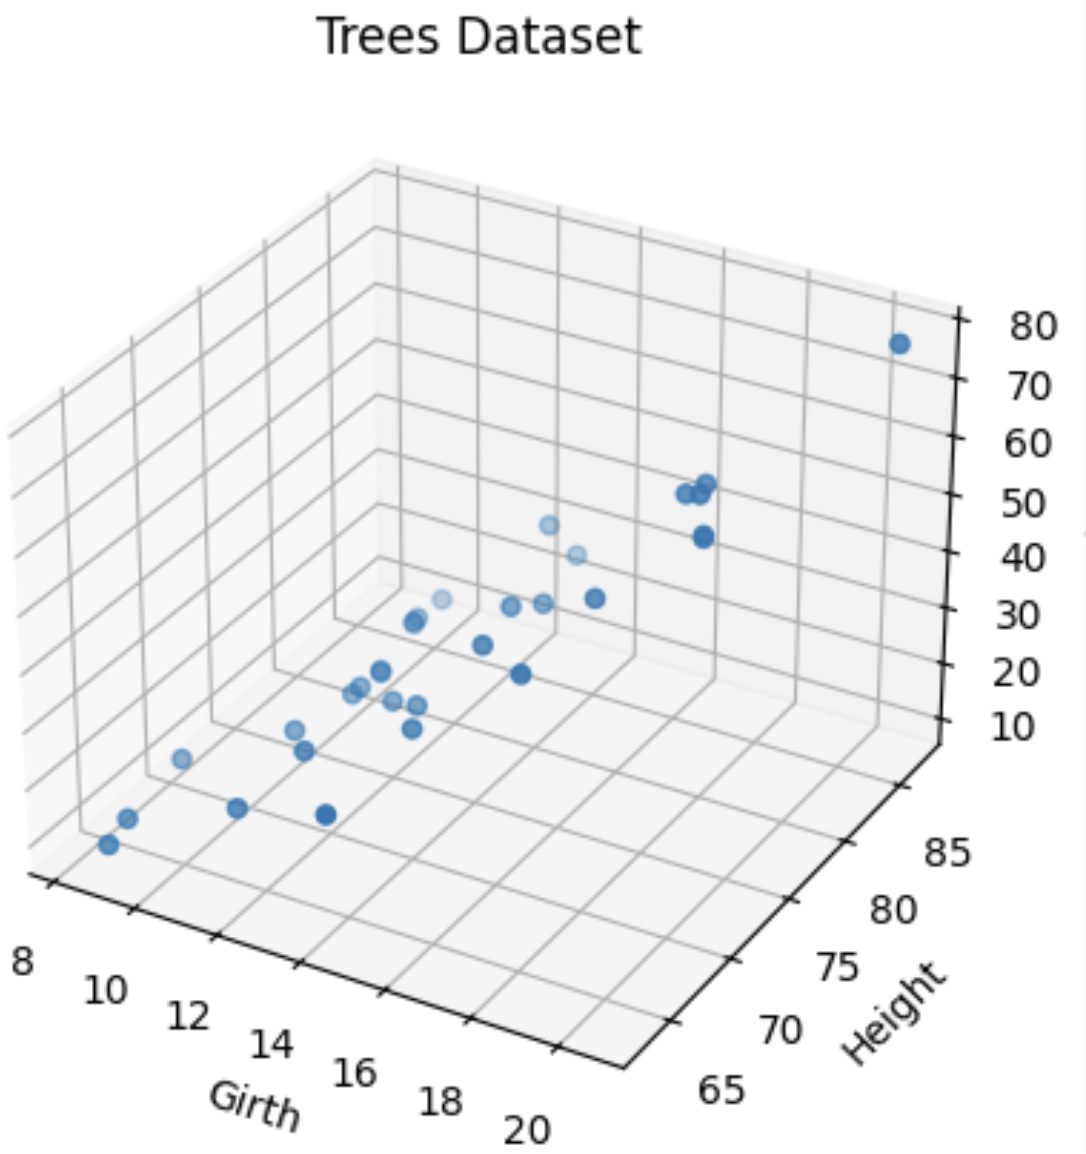
3D Data Visualization of the Data
This is a 3D plot of the tree dataset provided—essentially creating a graph depicting the volume on the z-axis and the girth on the x-axis and height on the y-axis. This is the training data for this model—the data used to predict the optimized parameters.
The Losses as Iterations Increase for Different Learning Rates
These are screenshots of the losses as iterations increase when using different learning rates for this linear regression model.
Code
You can find the code used for these results by clicking on this link.